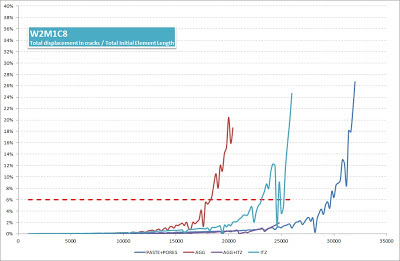
Lattice simulations are capable of simulating crack pattern due to various loading modes. Either Aggregate, ITZ or paste (open cracks). As simulations run till the system failure (or predeifned failure threshold strain) there is a challenge on deciding on the cut-off level of damage progress in 2D system. Thanks to help from my colleague Branko Savija, now we introduced a itterative way to calculate total crack opening on every step. This approach allows us to compare damaged images (with known duration, environmental conditions (accelerated test) mix properties and aggregate geometry distribution) with threshold cracks (based on pixel counts) with relative damage in the system of lattice beams. Total crack width calculations shall be smooted for outliers but comparison graphs look like tese:
Sample 1: Core from Nautesund Bridge S31-3
Simulations are based on loading modes; AGG, ITZ, AGG+ITZ, Paste (20% randomly distributed). Based on image analyses cut-off line is 6%
Sample 2: Cube from accelerated tests (60°C) duration 140 days - original mix design from Nautesund Bridge (w/c=0.5) - No Alkali boosting (Expansion value: 0.24%)
Simulations are
based on loading modes; AGG, ITZ, AGG+ITZ, Paste (20% randomly
distributed). Based on image analyses cut-off line is 6%
Sample 3: Cube from standard accelerated tests (60°C) duration 140 days - original aggregates from Nautesund Bridge (w/c=0.5) - Based on standard grading curve - No alkali boosting. (Expansion value: 0.14%)
Simulations are
based on loading modes; AGG, ITZ, AGG+ITZ, Paste (20% randomly
distributed). Based on image analyses cut-off line is 10%
This approach allows us indetify which loading modes progress faster. But there is still room for progress but initial results seems promising. Next step will be intentifying crack width growth by phase types and recalibration of material properties with Nanoindentation techniques.


No comments:
Post a Comment