Current sample size is 15mm x 15mm x 7 mm, resolution of images are around 13 microns\pixel. Largest observed crack width is roughly 80 microns.

Showing posts with label test. Show all posts
Showing posts with label test. Show all posts
Friday, 5 April 2013
CT-Scan of ASR reacted samples
Today I have been busy with a trial CT-scan of RILEM AAR-4 samples. The Main aim was to get a 3-dimensional view on how cracks were distributed in concrete medium. Following 3 videos show Top, Front and side view respectively. While progressing through the sample, we can see how cracks are located and progressed.
Current sample size is 15mm x 15mm x 7 mm, resolution of images are around 13 microns\pixel. Largest observed crack width is roughly 80 microns.
Current sample size is 15mm x 15mm x 7 mm, resolution of images are around 13 microns\pixel. Largest observed crack width is roughly 80 microns.


Friday, 21 December 2012
A Work in progress - NanoIndentation
By the end of 2012, (and no Apocalyptic events so far) I am trying to put together results of first set of Nano indentation.
As mentioned earlier, 4 specimens from 60°C testing (3 from original mix design + 1 RILEM standard mix design) are used for analyses. Main problem following indentation process is matching mechanical properties to exact locations on specimens. So far success rate of indent attempts are a bit low (around 55-70%). This was mainly due to some last minute revisions on samples and disturbing the flatness of our samples. Yet there are enough data for our purpose. With our new sample holders I believe this rate will raise drastically.
For the last week or so, I have been working on a Matlab code which gathers thousands of indent data, crunches the numbers and groups curves in to several E Modulus values (with 30GPa intervals). I have been working on a standardised way to identify (hypothesise) a way to identify locations of indents. As they are not (or very hardly visible) through light microscope, we needed to randomly distribute a grid on indent area, then check whether it is statistically comparable with NanoIndenter results.
Here is how it works.
\begin{example}
We had original documentation of our samples where interested indent areas are marked.
 |
| Micrograph image under stereo microscopy MagX0.63 - Each grid represents 4mm² area |
 |
| Micrograph image under stereo microscopy MagX4 - Each cross is placed 200microns from each other as indentation points were |
It is hardly visible from this image but manual point counting is applied on this image where each 200 microns increment is marked digitally. Finally we end up with two images for matching and comparison purposes. First one representing hypothetical distribution of indent points and their corresponding material phases. Second one a representation of how E-modulus values vary through indentation grid.
 |
| Point count results |
 |
| Surface map diagram of Indent results for E (GPa) values |
This methods allows a standard way to overlay test results with real material properties. This can be further investigated by correlating findings with following subgroups of indent results shown in subplots.

\end{example}
Next set of experiments will start in Jan 3rd 2013. Till then,
Merry Christmas and a happy New year to All.
Monday, 10 December 2012
Nano indentation test is ...still.. running
With a bit of smallish problems last Tuesday we started our first batch of Nano Indentation tests.
 First batch covers samples from Nautesund Bridge Original mix 1 (Prisms 1-2-3) and Nautesund aggregate Standard AAR-4 testing (Prism 5). All samples were subjected to 60°C and %100 humidity for 140 days. A total of 850 indent points selected for 4 samples (roughly 15mm X 15 mm).
On the 6th day of experiments, Indentation still continues... Needle is on the final indent group though.
 Hopefully, by the end of today, we will get our samples our for further investigation
On the 6th day of experiments, Indentation still continues... Needle is on the final indent group though.
Wednesday, 5 December 2012
Nano indentation
Recently I have been working on ways to identify material properties of phases in my concrete samples. As of yesterday we started with our first Nano indentation test. The main aim of this study will be to identify dissolved properties of aggregate and paste in the matrix with known exposure to Accelerated test conditions. Here is a short photo series of how we prepared samples for nano-indenter.

 |
| We cut sections from expansion prism (roughly 1.5 cm thick) |
 |
| Sections are organized named and further selections are marked |
 |
| Smaller Specimens are prepared to fit the sample holder for Nano Indentation |
Sunday, 18 November 2012
Timing of Damage - Cutoff level in simulation results
Lattice simulations are capable of simulating crack pattern due to various loading modes. Either Aggregate, ITZ or paste (open cracks). As simulations run till the system failure (or predeifned failure threshold strain) there is a challenge on deciding on the cut-off level of damage progress in 2D system. Thanks to help from my colleague Branko Savija, now we introduced a itterative way to calculate total crack opening on every step. This approach allows us to compare damaged images (with known duration, environmental conditions (accelerated test) mix properties and aggregate geometry distribution) with threshold cracks (based on pixel counts) with relative damage in the system of lattice beams. Total crack width calculations shall be smooted for outliers but comparison graphs look like tese:
Sample 1: Core from Nautesund Bridge S31-3
Simulations are based on loading modes; AGG, ITZ, AGG+ITZ, Paste (20% randomly distributed). Based on image analyses cut-off line is 6%
 Sample 2: Cube from accelerated tests (60°C) duration 140 days - original mix design from Nautesund Bridge (w/c=0.5) - No Alkali boosting (Expansion value: 0.24%)
Simulations are based on loading modes; AGG, ITZ, AGG+ITZ, Paste (20% randomly distributed). Based on image analyses cut-off line is 6%
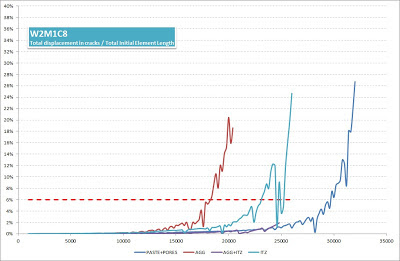
Sample 3: Cube from standard accelerated tests (60°C) duration 140 days - original aggregates from Nautesund Bridge (w/c=0.5) - Based on standard grading curve - No alkali boosting. (Expansion value: 0.14%)
Simulations are based on loading modes; AGG, ITZ, AGG+ITZ, Paste (20% randomly distributed). Based on image analyses cut-off line is 10%

This approach allows us indetify which loading modes progress faster. But there is still room for progress but initial results seems promising. Next step will be intentifying crack width growth by phase types and recalibration of material properties with Nanoindentation techniques.
Sample 1: Core from Nautesund Bridge S31-3
Simulations are based on loading modes; AGG, ITZ, AGG+ITZ, Paste (20% randomly distributed). Based on image analyses cut-off line is 6%

Simulations are based on loading modes; AGG, ITZ, AGG+ITZ, Paste (20% randomly distributed). Based on image analyses cut-off line is 6%

Sample 3: Cube from standard accelerated tests (60°C) duration 140 days - original aggregates from Nautesund Bridge (w/c=0.5) - Based on standard grading curve - No alkali boosting. (Expansion value: 0.14%)
Simulations are based on loading modes; AGG, ITZ, AGG+ITZ, Paste (20% randomly distributed). Based on image analyses cut-off line is 10%

This approach allows us indetify which loading modes progress faster. But there is still room for progress but initial results seems promising. Next step will be intentifying crack width growth by phase types and recalibration of material properties with Nanoindentation techniques.
Friday, 2 March 2012
First 2D simulations
Using digital imaging from reacted structure samples, we managed to run a 2D simulation for ASR expansion (size of 9.6 cm x 9.6 cm) .


Using thresholding and edge detection images are convereted to binary images. Three Phases (aggregate - mortar - ITZ) identified and superimposed with a lattice mesh including (79600 beam elements). Based on earlier studies (Schlangen and Copuroglu, 2010) material properties are assigned and expansion is defined on all interfacial transition zone (ITZ) elements.


First attempts assumed local lodings on the ITZ elements only and swelling to start simultaneously. Currently we are working on identification reactive components in a 2D medium and implementing non-simultaneous expansion patterns in the section. After execution of small scale testing device we will have more insights about pressure progress and gel propeties (those details for another post). Alternate reactive regions and shifted timing regimes to be defined later on.

Still a lot to do, in modeling but first results seems promising for improvement.
Schlangen, E. and C. Copuroglu (2010). Modeling of expansion and cracking due to ASR with 3D lattice model. Framcos7, Jeju, Korea.


Using thresholding and edge detection images are convereted to binary images. Three Phases (aggregate - mortar - ITZ) identified and superimposed with a lattice mesh including (79600 beam elements). Based on earlier studies (Schlangen and Copuroglu, 2010) material properties are assigned and expansion is defined on all interfacial transition zone (ITZ) elements.


Cracked beam elements after 3000-8000-20000 steps.
First attempts assumed local lodings on the ITZ elements only and swelling to start simultaneously. Currently we are working on identification reactive components in a 2D medium and implementing non-simultaneous expansion patterns in the section. After execution of small scale testing device we will have more insights about pressure progress and gel propeties (those details for another post). Alternate reactive regions and shifted timing regimes to be defined later on.

Deformed version of sample after 20000 steps
Schlangen, E. and C. Copuroglu (2010). Modeling of expansion and cracking due to ASR with 3D lattice model. Framcos7, Jeju, Korea.
Performance Testing for AAR (Nautesund)
(A delayed post)
After busy preparation period in November, it's been a productive December for experiments. Reassuring way to end year 2011. Experimental part of our project is divided into several workpackages consisting of RILEM AAR-3 (38°C) and AAR-4 (60°C) performance tests.

One of which is backward compatibility tests. By the courtesy of Norwegian Public Roads Department, we have accessed materials from Nautesund bridge.

As mentioned earlier, we have received several cores from Norway.
After analysis on the samples, original mix has been identified. In December we cast 4 mixes (3 of which with original mix design -with varied w/c ratios, and 1 standard RILEM recommended mix). Currently running performance tests on these specimens.
Preliminary results show that specimens reached RILEM limits within 5 weeks in to the experiment (espacially for 60°C test)
To understand the progress of gel and crack propagation within sample we have adopted extra specimens sizes of 10x10x10 cm.These samples will be used for thin and polished section analyses. Data collection schedule for a standard concrete performance testing is as follows:
For performance and parameter testing more castings are schedules for March 2012.
... more results and detailed analysis to follow, soon.
After busy preparation period in November, it's been a productive December for experiments. Reassuring way to end year 2011. Experimental part of our project is divided into several workpackages consisting of RILEM AAR-3 (38°C) and AAR-4 (60°C) performance tests.

One of which is backward compatibility tests. By the courtesy of Norwegian Public Roads Department, we have accessed materials from Nautesund bridge.

As mentioned earlier, we have received several cores from Norway.
After analysis on the samples, original mix has been identified. In December we cast 4 mixes (3 of which with original mix design -with varied w/c ratios, and 1 standard RILEM recommended mix). Currently running performance tests on these specimens.
Preliminary results show that specimens reached RILEM limits within 5 weeks in to the experiment (espacially for 60°C test)
 |
| AAR-4 (60°C Expansion values as of 01/03/2012) |
 |
| Data collection scheme for RILEM recommended testing |
 |
| Specimen quantities and dimensions |
For performance and parameter testing more castings are schedules for March 2012.
... more results and detailed analysis to follow, soon.
Friday, 21 October 2011
Very Preliminary test results
In TUD laboratories,
we are executing accelerated performance tests –which are defined by AAR study groups of RILEM committee-. Results from these
tests and analyses on the samples will be used for backward compatibility
checks with cores/information from existing affected structures and ongoing
studies on parameter characterisation in literature.
Later batch of mixes will be aiming to get the same mix as Nautesund Birdge in Oslo, Norway. This bridge was built in 1958 and demolished in 2009. ASR has been diagnosed as a part of degradation, and overall assessment of the bridge, thus final demolition decision.


Pictures from the construction of Nautesund Bridge - courtesy of Ingvar Hellestad, (special thanks to Per Hagelia).


Currently validations test with 4 mixes, based on Norwegian Reference concrete are running for RILEM AAR-3 @ 38° C and AAR-4 @ 60° C tests. Current mixes involve Aggregates : Ardal, Spratt and Ottersbo and cements from NORCEM Cement CEMI : Industri and Anlegg. These results will be used for the confirmation of TUD Labs testing performance. Very preliminary expansion results to follow (as of 21st Oct, 2011):


Pictures from the construction of Nautesund Bridge - courtesy of Ingvar Hellestad, (special thanks to Per Hagelia).
Polished section from 7 original cores are under preparation process. We are hoping to get comparable results early 2012.


Currently validations test with 4 mixes, based on Norwegian Reference concrete are running for RILEM AAR-3 @ 38° C and AAR-4 @ 60° C tests. Current mixes involve Aggregates : Ardal, Spratt and Ottersbo and cements from NORCEM Cement CEMI : Industri and Anlegg. These results will be used for the confirmation of TUD Labs testing performance. Very preliminary expansion results to follow (as of 21st Oct, 2011):
Wednesday, 17 November 2010

Subscribe to:
Posts (Atom)