Friday, 21 December 2012

A Work in progress - NanoIndentation

By the end of 2012, (and no Apocalyptic events so far) I am trying to put together results of first set of Nano indentation.
As mentioned earlier, 4 specimens from 60°C testing (3 from original mix design + 1 RILEM standard mix design) are used for analyses. Main problem following indentation process is matching mechanical properties to exact locations on specimens. So far success rate of indent attempts are a bit low (around 55-70%). This was mainly due to some last minute revisions on samples and disturbing the flatness of our samples. Yet there are enough data for our purpose. With our new sample holders I believe this rate will raise drastically.

For the last week or so, I have been working on a Matlab code which gathers thousands of indent data, crunches the numbers and groups curves in to several E Modulus values (with 30GPa intervals). I have been working on a standardised way to identify (hypothesise) a way to identify locations of indents. As they are not (or very hardly visible) through light microscope, we needed to randomly distribute a grid on indent area, then check whether it is statistically comparable with NanoIndenter results.

Here is how it works.

\begin{example}

We had original documentation of our samples where interested indent areas are marked.

Micrograph image under stereo microscopy MagX0.63 - Each grid represents 4mm­² area
After indentations is performed another micrograph is taken with a higher magnification (4X) for detailing indent area alone.
Micrograph image under stereo microscopy MagX4 - Each cross is placed 200microns from each other as indentation points were
It is hardly visible from this image but manual point counting is applied on this image where each 200 microns increment is marked digitally. Finally we end up with two images for matching and comparison purposes. First one representing hypothetical  distribution of indent points and their corresponding material phases. Second one a representation of how E-modulus values vary through indentation grid.
Point count results
Surface map diagram of Indent results for E (GPa) values
This methods allows a standard way to overlay test results with real material properties. This can be further investigated by correlating findings with following subgroups of indent results shown in subplots.


\end{example}

Next set of experiments will start in Jan 3rd 2013. Till then,

Merry Christmas and a happy New year to All.


Wednesday, 19 December 2012

What did I learned in 2012?

It is time to draw a balance for the 2012. For PAT-ASR PhDs this was a great year, full of work and new ideas!
So, what did I learn this year? A lot of interesting knowledge about concrete and concrete matters useful for life!


About concrete matters 
  • your background forms your point of view and your point of view hides your hypotheses, which means that some times you have to defend/change/reevaluate your hypothesis!
  • it is really important how you present your work and especially how you present yourself, be open to new ideas, new critics and everything new! (it can be not so bad!).

About concrete (numerical point of view):

  • I studied Poromechanics Theory, a so amusing theory which can bridge micro and macro modeling level.
  • I studied Homogenization Theory.
  • I learned how to play with tensors and how to represent them in matrix and column vector.
  • I started to use Matlab! After a while you get why there are so many nerd people around!
About concrete (the real one):


  • I learned how to perform mechanical tests of concrete specimens in laboratory.
  • I learned how to build up a device and how many things can go wrong in once!
  • I learned how to make concrete, like construction workers do! (and for a numerical person, this is not so obvious!)
  • and I think that make concrete it is like make a cake... do you have some doubts? Than look at this:


I hope you also learned something important this year, and in general that your life and your professional life was full of great experiences! If not, don't worry there is still time!
I wish to our followers a Merry Christmas and an Happy New Year! 
See you in 2013...there is still a lot to do!

Monday, 10 December 2012

Nano indentation test is ...still.. running

With a bit of smallish problems last Tuesday we started our first batch of Nano Indentation tests.
First batch covers samples from Nautesund Bridge Original mix 1 (Prisms 1-2-3) and Nautesund aggregate Standard AAR-4 testing (Prism 5). All samples were subjected to 60°C and %100 humidity for 140 days. A total of 850 indent points selected for 4 samples (roughly 15mm X 15 mm).

On the 6th day of experiments, Indentation still continues... Needle is on the final indent group though.
Hopefully, by the end of today, we will get our samples our for further investigation

Friday, 7 December 2012

Going to the Basis...

Since I enter in the "fabulous" word of  Poromechanics and Homogenization theories I started to see that their formulation is written in tensor notation. (More information of tensor algebra can be found at http://www.foamcfd.org/Nabla/guides/ProgrammersGuidese3.html)

Every engineer remember that one in some lecture the professor told to him/her:
"The stiffness tensor is a  4th order tensor that has 81 constants. Due to symmetry when can reduce the number of this constants and we can write it as matrix 6x6". 
After that the word "tensor" is complete disappeared from our world and we keep write the stress strain relationship as:


or better:


Of course everything is fine till we go from strain to stress and the other way around. But what happen if I need to multiply the stiffness or the compliance tensors for other tensors? Can i still use the matrix notation?
My thought was, maybe yes. But actually is not totally true... I mean we need to pay attention to how we write the matrix form. And we have to remember that matrix operations and tensor operations are not equivalent!
A clear explanation of this issue can be found in the presentation of Klaus Helbig, titled "The Structure of the Elastic Tensor. A study of the possibilities opened up by Kelvin 150 years ago." (if you are interested in, just google the title!)

Conclusion: some time we forgot where some assumptions are coming from, but still they can make a lot of difference!


Self healing concrete and asphalt: Erik Schlangen at TEDxDelft 2012

Wednesday, 5 December 2012

Nano indentation

Recently I have been working on ways to identify material properties of phases in my concrete samples. As of yesterday we started with our first Nano indentation test. The main aim of this study will be to identify dissolved properties of aggregate and paste in the matrix with known exposure to Accelerated test conditions. Here is a short photo series of how we prepared samples for nano-indenter.

We cut sections from expansion prism (roughly 1.5 cm thick)
Sections are organized named and further selections are marked
Smaller Specimens are prepared to fit the sample holder for Nano Indentation

Sunday, 18 November 2012

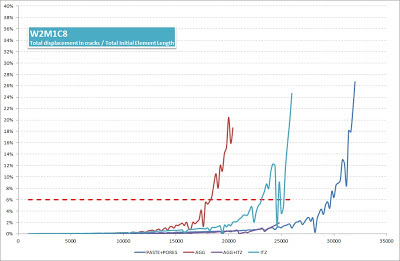
Timing of Damage - Cutoff level in simulation results

Lattice simulations are capable of simulating crack pattern due to various loading modes. Either Aggregate, ITZ or paste (open cracks). As simulations run till the system failure (or predeifned failure threshold strain) there is a challenge on deciding on the cut-off level of damage progress in 2D system. Thanks to help from my colleague Branko Savija, now we introduced a itterative way to calculate total crack opening on every step. This approach allows us to compare damaged images (with known duration, environmental conditions (accelerated test) mix properties and aggregate geometry distribution) with threshold cracks (based on pixel counts) with relative damage in the system of lattice beams. Total crack width calculations shall be smooted for outliers but comparison graphs look like tese:

Sample 1: Core from Nautesund Bridge S31-3
Simulations are based on loading modes; AGG, ITZ, AGG+ITZ, Paste (20% randomly distributed). Based on image analyses cut-off line is 6%
Sample 2: Cube from accelerated tests (60°C) duration 140 days - original mix design from Nautesund Bridge (w/c=0.5) - No Alkali boosting (Expansion value: 0.24%)
Simulations are based on loading modes; AGG, ITZ, AGG+ITZ, Paste (20% randomly distributed). Based on image analyses cut-off line is 6%

Sample 3: Cube from standard accelerated tests (60°C) duration 140 days - original aggregates from Nautesund Bridge (w/c=0.5) - Based on standard grading curve - No alkali boosting. (Expansion value: 0.14%)
Simulations are based on loading modes; AGG, ITZ, AGG+ITZ, Paste (20% randomly distributed). Based on image analyses cut-off line is 10%

 This approach allows us indetify which loading modes progress faster. But there is still room for progress but initial results seems promising. Next step will be intentifying crack width growth by phase types and recalibration of material properties with Nanoindentation techniques.

A PhD's Data flow

Looks like a lot more to accomplish... That's phd-life..

Thursday, 25 October 2012

Experimental Works

Castings for mechanical testing is almost finished. It has been (and still will be) two busy casting week. Another News is Our 60°C Reactor from Schleibinger has leakage problems.

Unfortunately this results in more delay on our 4th workpackage. The initial plan was to cast in May, 2012. But due to problems we postponed this date. With these unfortunate news we are facing another delay of couple of months. Unlucky for a PhD work...

fingers Crossed...

Friday, 19 October 2012

Mechanical Properties Degradation due to ASR-Swelling: The show has been started!!

After several trails (e.g. Trial Tests 1 ) and a long preparation, this week the first sample have been casted.
Just to give some numbers:
- 425 lt. of concrete will be produced
- in 6 casting along 4 weeks
- 107 sample
- 14 Young's modulus test, 14 splitting tensile test, 6 compressive strength tests will be performed along 52 weeks.
- 5 home made reactor will host the specimens during the storing time.

Here you can find some pictures of our work:

Home Made reactors.


Heater (bottom) and Controller (top) outside view.

Heater (bottom) and Controller (top) inside view.

Small Boxes in which the sample are stored.

Mould 10x10x40 cm for sample used in the Young's modulus test.

Mould 15x15x15 cm for sample used in the splitting tensile strength.


Thursday, 4 October 2012

Erik Schlangen in TEDx Talks

Professor Erik Schlangen will give a talk about "self-healing concrete and asphalt" part of TEDx Delft tomorrow (05 Oct 2012) at 12:18. Don't Miss it.
You can stream his talk via: http://www.tedxdelft.nl/livestream/
or you can watch it later on TEDxDelft web site: http://www.tedxdelft.nl/ .

4th Users' Committee Meeting

Biannual Meeting with our academic and industrial partners was held today (04/10/2012) in TU Delft. It has been a fruitful meeting and many constructive discussions. We would like to thank all our Users for their participation...

PAT-ASR Team

Thursday, 20 September 2012

Back in the village - After ICCRRR

Pat-asr and M3C4 teams representing Microlab in Cape town.
Third International Conference on Concrete Repair, Rehabilitation and Retrofitting was held in Cape Town, South Africa. Our team has the opportunity to get in touch with experts in our field and present our work.It has been a successful organization. We also had the pleasure of visiting beautiful Cape Town. It's time to pick up where we left.


Monday, 27 August 2012

More images on 3 different samples

Work in progress. Here is crack development for 3 different samples based on different loading conditions, various aggregate size and agg/paste ratio.

Currently working on quantification of damage obtained from simulations. Regarding our previous post these are attempts to understand the crack formation mechanism (and hopefully fitting on a timeline).

Friday, 24 August 2012

SIMULATION: Crack formation under Aggregate Expansion

We have been trying to run simulations on various loading conditions and material properties to investigate crack formation in 2D sections. While we are busy with sample analyses and running simulations, here is a taster (if you may call it a result) video of how cracks grow under expanding aggregates. This simulation is based on a real test specimen (Upside down though).


Simulations continue till the specimen fails (or reaches a predefined stain level). You may realise some simplification on the section identification. Here are how the original sections look like. These specimens have been kept in 60°C reactor (RH 100%) for 20 weeks before sample preparation process.

 1- Normal Light Image
2- UV Light Image

Specimens are based on original mix design of Nautesund Bridge. you can find more information about this testing campaign here.
I have also done damage rating index analyses on this (and various other) specimens based on method defined by Grattan-bellew (1992). Some results regarding These analysis are as follows:
 Damage rating index - calculated based on Grattan Bellew (1992)
Distribution of Crack types observed on our samples

DRI analyses and simulations are continuing in full speed. Soon I will provide more data (and definitely more results) on our blog.

Busy months ahead..


FRAMCOS - 8: Call for Papers

8th International Conference on Fracture Mechanics of Concrete and Concrete Structures will be held in Toledo Spain, March 2013. Deadline for Paper submission is 15 September, approaching.

Hopefully we will be there to present our findings.

Wednesday, 22 August 2012

PAT-ASR team in ICCRRR, Cape Town

It is almost time for yet another big conference on concrete research. We are participating in 3rd International Conference on Concrete Repair Rehabilitation and Retrofitting in Cape Town, South Africa. We are presenting two papers in this conference. It will exciting to meet and interact with colleagues around the world.


It's a long flight with an exciting ending. Looking forward to it.

Friday, 6 July 2012

Mechanical Properties Degradation due to ASR-Swelling: Trial Tests 1

Our experimental campaign is becoming larger! We decided to have look also to the degradation of the mechanical properties due to ASR-swelling. 
We will store the specimens in homemade reactors which ensure a temperature of 38C and RH>95%.

Homemade reactors.

The specimens will be tested for Young's modulus and splitting tensile strength.
Just to get familiar with the type of test and the test machines, we had a trail cast at the middle of June and that week we performed the experiments.
Here there are some pictures of the tests.

Preparation specimens for the Young's Modulus test.

Disposition of LDVT for the Young's Modulus test.

Young's Modulus test.

Splitting tensile test.

Crack pattern after splitting tensile test.

Crack pattern after splitting tensile test.


Tuesday, 29 May 2012

14th ICAAR - Austin, Texas

ICAAR conference series continued in Austin, Texas. Thanks to University of Texas, it has been a remarkable organization from 21st to 25th May. It has been a warm but a knowledgeable week for PAT-ASR team. We had the opportunity to experience interesting researches from around the world. We have share knowledge and connected with researches from our field. Our team also presented 2 papers during the conference and collected useful feedback. one of the highlights of the conference was the visit to Texas University ASR Exposure site (see images). They showing a considerable effort and dedication to run this site.

Over all, it has been a informative week for everyone.

Monday, 14 May 2012

Gel Expansion and Loading differences in model

Crack formation changes according to localization of the gel. this correlation brings a challenge in modelling. Which loading point will successfully represent Gel expansion?
Recently explored various loading options on a hypothetical section with a low aggregate-paste ratio. Different images represent various loading points, On; aggregate, ITZ, aggregate+ITZ, respectively.


Also comparative stress distribution after certain amount of crack growth


Friday, 2 March 2012

First 2D simulations

Using digital imaging from reacted structure samples, we managed to run a 2D simulation for ASR expansion (size of 9.6 cm x 9.6 cm) .


Using thresholding and edge detection images are convereted to binary images. Three Phases (aggregate - mortar - ITZ) identified and superimposed with a lattice mesh including (79600 beam elements). Based on earlier studies (Schlangen and Copuroglu, 2010) material properties are assigned and expansion is defined on all interfacial transition zone (ITZ) elements.


Cracked beam elements after 3000-8000-20000 steps.

First attempts assumed local lodings on the ITZ elements only and swelling to start simultaneously. Currently we are working on identification reactive components in a 2D medium and implementing non-simultaneous expansion patterns in the section. After execution of small scale testing device we will have more insights about pressure progress and gel propeties (those details for another post). Alternate reactive regions and shifted timing regimes to be defined later on.

Deformed version of sample after 20000 steps

Still a lot to do, in modeling but first results seems promising for improvement.


Schlangen, E. and C. Copuroglu (2010). Modeling of expansion and cracking due to ASR with 3D lattice model. Framcos7, Jeju, Korea.